To obtain a high level of income consistent with security of capital through investments primarily in securities issued or guaranteed by the Government of Canada or one of the provinces thereof, municipal or school corporations in Canada and in first mortgages on properties situated in Canada, interest-bearing deposits of banks or trust companies and high quality corporate bonds.
Minimum Initial Investment:
Lump Sum
Initial: $500
Subsequent: $100
The monthly distribution amounts may change from time to time at our discretion.
| Front-End Load Option | ATL1021 |
|---|---|
| Back-End Load Option | - |
| Low Load Option | - |
| Closed to all purchases | |||||||||
| Front-End Load Option | - | ||||||||
|---|---|---|---|---|---|---|---|---|---|
| Back-End Load Option** | ATL2121 | ||||||||
| Low Load Option** | ATL1121 | ||||||||
| Inception Date | Oct 1, 1974 |
|---|---|
| Fund Code | ATL1121 |
| Assets Under Management ($000) As at : December 31, 2025 | $251,804 |
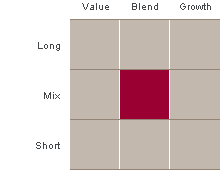
Investment Style

| Term to Maturity (Years) †† | Duration (Years) †† | Average YTM (%) †† |
| 2.98 | 2.81 | 3.35 |
The time remaining on a bond's life, or the date on which the debt will cease to exist and the borrower will have completely paid off the amount borrowed.
Duration (Years)
Duration is defined as the weighted average time to full recovery of principal and interest.
Yield to Maturity (Average YTM)
The percentage rate of return paid on a bond, note or other fixed income security if the investor buys and holds it to its maturity date. The calculation for YTM is based on the coupon rate, length of time to maturity and market price. It assumes that coupon interest paid over the life of the bond will be reinvested at the same rate.
| 3 mo | 6 mo | YTD | 1 yr | 3 yrs | 5 yrs | 10 yrs | Since Inception |
|---|---|---|---|---|---|---|---|
| 0.2% | 1.3% | 3.2% | 3.2% | 4.2% | 1.1% | 1.2% | 5.7% |
As at: December 31, 2025 Performance figures are net of fees.
| 2024 | 2023 | 2022 | 2021 | 2020 | 2019 | 2018 | 2017 | 2016 | 2015 |
|---|---|---|---|---|---|---|---|---|---|
| 5.0% | 4.4% | (5%) | (1.9%) | 4.30% | 2.7% | (0.07%) | 1.9% | 0.0% | 1.1% |
The rate of return or mathematical table shown is used only to illustrate the effects of the compound growth rate and is not intended to reflect future values of the fund or returns on investment in the fund.
†Please refer to the Annual/Interim Management Reports of Fund Performance for further details.
**Effective May 13, 2022, all deferred sales charge (referred to as DSC) purchase options (i.e. back-end load and low-load options) are closed to new purchases, including purchases through pre-authorized chequing plans. Switches to units of another Fund managed by CIBC Asset Management Inc. under the same DSC purchase option will continue to be available.
This material is provided for general informational purposes only and does not constitute financial, investment, tax, legal or accounting advice nor does it constitute an offer or solicitation to buy or sell any securities referred to.
Commissions, trailing commissions, management fees and expenses all may be associated with mutual fund investments. Please read the simplified prospectus before investing. To obtain a copy of the simplified prospectus, call 1-888-888-FUND (3863). Alternatively, you may obtain a copy from your advisor.
Any information or discussion about the current characteristics of this mutual fund or how the portfolio manager is managing the mutual fund that is supplementary to information in the prospectus is not a discussion about material investment objectives or strategies, but solely a discussion of the current characteristics or manner of fulfilling the investment objectives and strategies, and is subject to change without notice.
The indicated rates of return are the historical annual compounded total returns including changes in unit value and reinvestment of all distributions, but do not take into account sales, redemption, distribution or optional charges or income taxes payable by any unitholder that would have reduced returns.
Mutual fund securities are not covered by the Canada Deposit Insurance Corporation or by any other government deposit insurer, nor are they guaranteed.
Past performance may not be repeated and is not indicative of future results.
The material and/or its contents may not be reproduced without the express written consent of CIBC Asset Management Inc.


